50 things each industry tracks that generic CRMs miss
Every industry has its own language, its own KPIs, its own pipeline stages, and its own definition of "a good week." Generic CRMs flatten all of that into "deals," "stages," and "contacts." That's why the salespeople using them quietly run their real numbers in a spreadsheet on the side. This post lists 50 nuances per vertical — 300 total — that should be in the dashboard, not in someone's head.
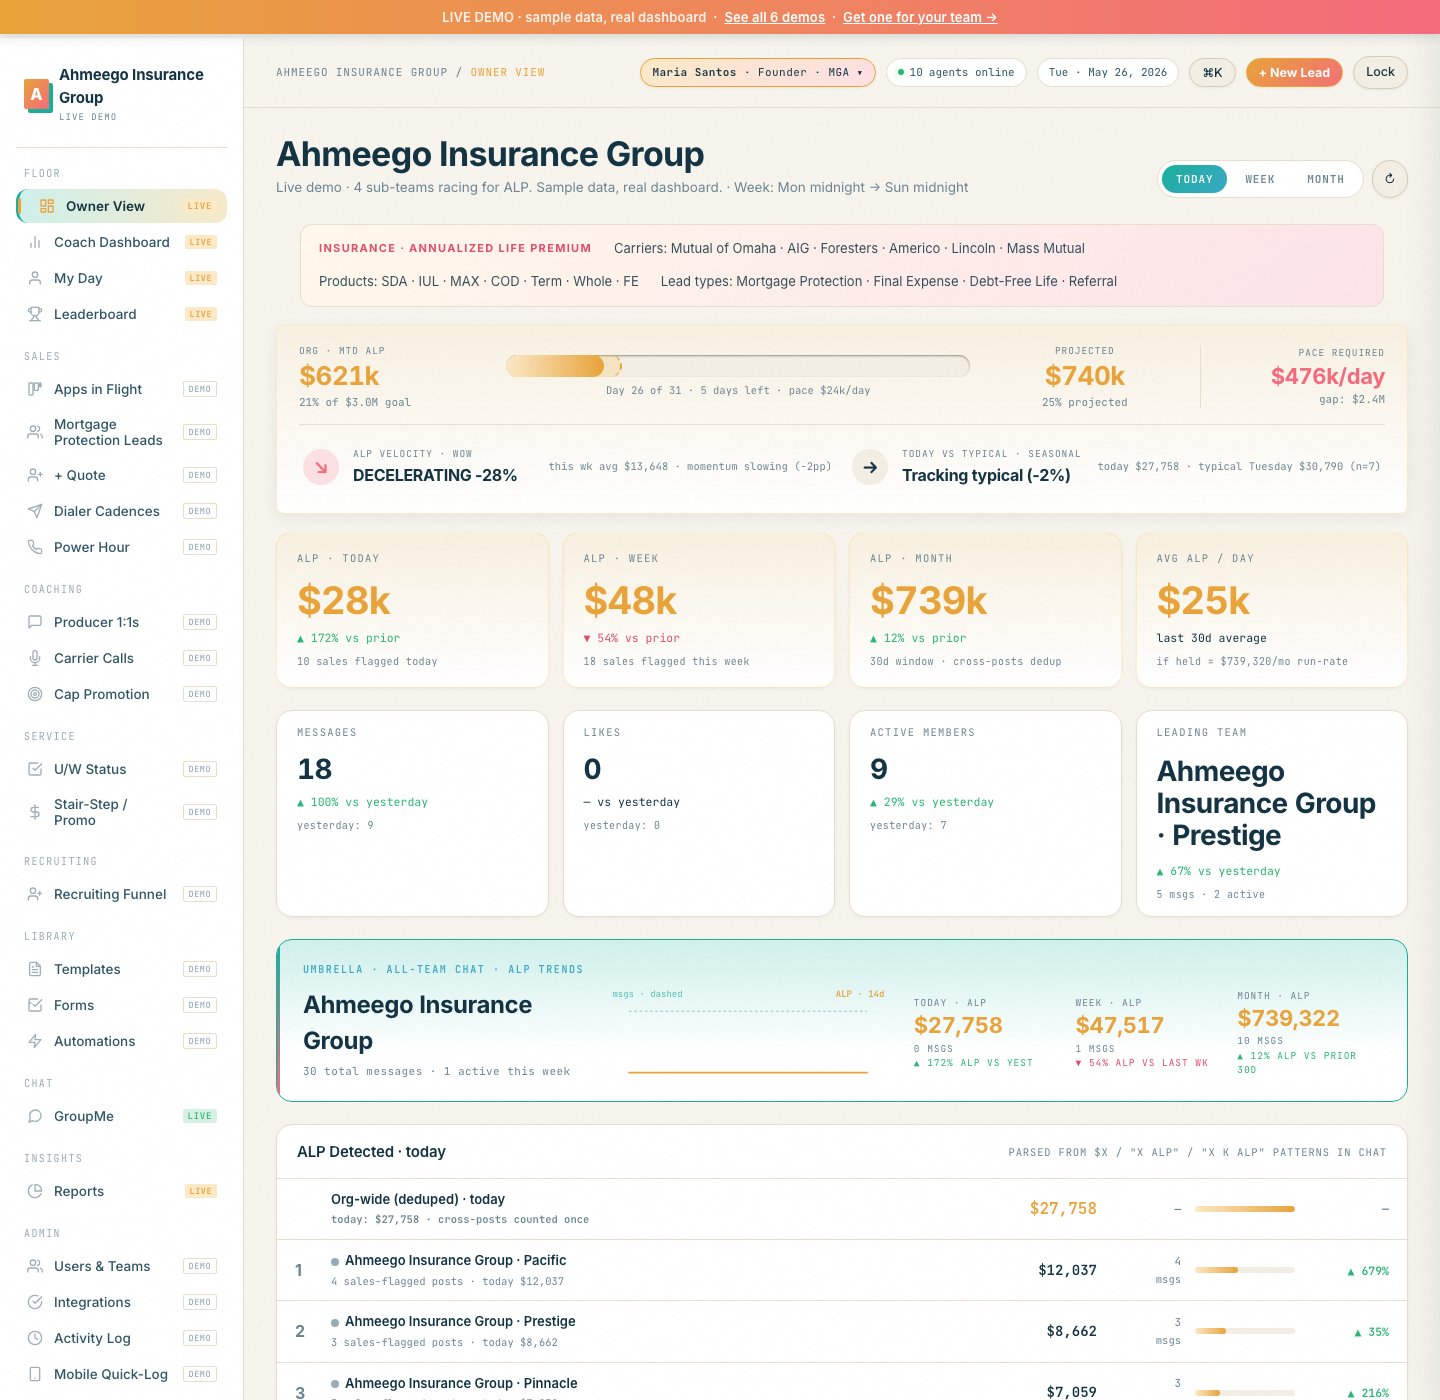
The same engine. Six different vocabularies. Every demo below is live and drawing from real (synthetic) data — go click around.
01 · InsuranceLife Insurance Agencies Open demo →
Carriers: Mutual of Omaha · AIG · Foresters · Americo · Lincoln · Mass Mutual · Transamerica · Prudential
Metrics that matter
- ALP (Annualized Life Premium) — north-star metric, not "revenue"
- Submitted ALP vs Issued ALP vs Paid ALP — three different numbers
- Persistency — % of policies still paying 13 months in
- Lapse rate — first-30-day, first-90-day, first-year buckets
- Free-look chargebacks — cancellations within 10-30 days
- IBP (Issued + Bonus + Paid) — agency-wide health metric
- Production-to-recruit ratio — IMO health
- SDA (Simple Dollar Amount) — mortgage-protection product
- MAX — Foresters max-accumulator IUL
- COD — Americo's living-benefits product
- IUL — Indexed Universal Life, high-ticket sale
- Term life — entry-level, low ALP per app
- Whole life — higher ALP, longer commission tail
- Annuities — separate license, usually a referral
- Pipeline stages — Lead → Quote → App → U/W → Issued → Paid
- AUS status — standard · table-rated · postponed · declined
- POS interview — required by most carriers, 24-72hr delay
- MVR + Rx check — knocks out 15-20% of apps
- Tele-app vs e-app vs paper — different conversion rates
- Mortgage protection — $35-60 CPL lead band
- Final expense — $25-45 CPL, older demo
- IUL leads — $80-150 CPL, qualified
- Debt-free life — Symmetry-style proprietary lead
- Referral / orphan policies — best-converting source
- Carrier-specific contracting — 5-15 carriers per agent
- Stair-step commissions — CC → EC → MGA → SA → RVP
- Recruiting funnel — interviews per recruit, recruits per writer
- 90-day washout rate — ~60-70% wash out is "normal"
- New agent first-sale velocity — days contract → first issued app
- Cap promotion thresholds — annualized production tiers
- Symmetry / FFL / Hegemon / Equis — IMO hierarchy matters
- Override structure — upline gets % of every writer's production
- Power Hour — 6-8pm dial blocks
- Setting calls vs closing calls — different muscles
- Aged leads (30/60/90-day) — different conversion curves
- Live transfer vs scheduled appt vs cold dial
- Saturday morning closes — religious demo, hardest convert window
- Commission week Mon midnight → Sun midnight (most agencies)
- Production reset every Monday morning huddle
- Daily NWP report (Net Written Premium)
- Underwriter scorecard by carrier
- First-year persistency report monthly
- Promotion tracker — annualized run-rate vs next tier
- Recruit attribution — who recruited whom (multi-level)
- Activity-based coaching — dials, sets, sits, sales
- Objection libraries — "can't afford" · "need to think"
- Scripts by demographic — under-35 vs over-65 differ
- Mindset coaching — most agencies overweight this
- Vacation / cap / promotion celebration — public recognition is fuel
- Conditional approval — APS from doc, 3-5 day delay
02 · Real EstateReal Estate Brokerages Open demo →
Lead sources: Zillow · Realtor.com · Sphere · FSBO · Expired · Open House · Door-knocking
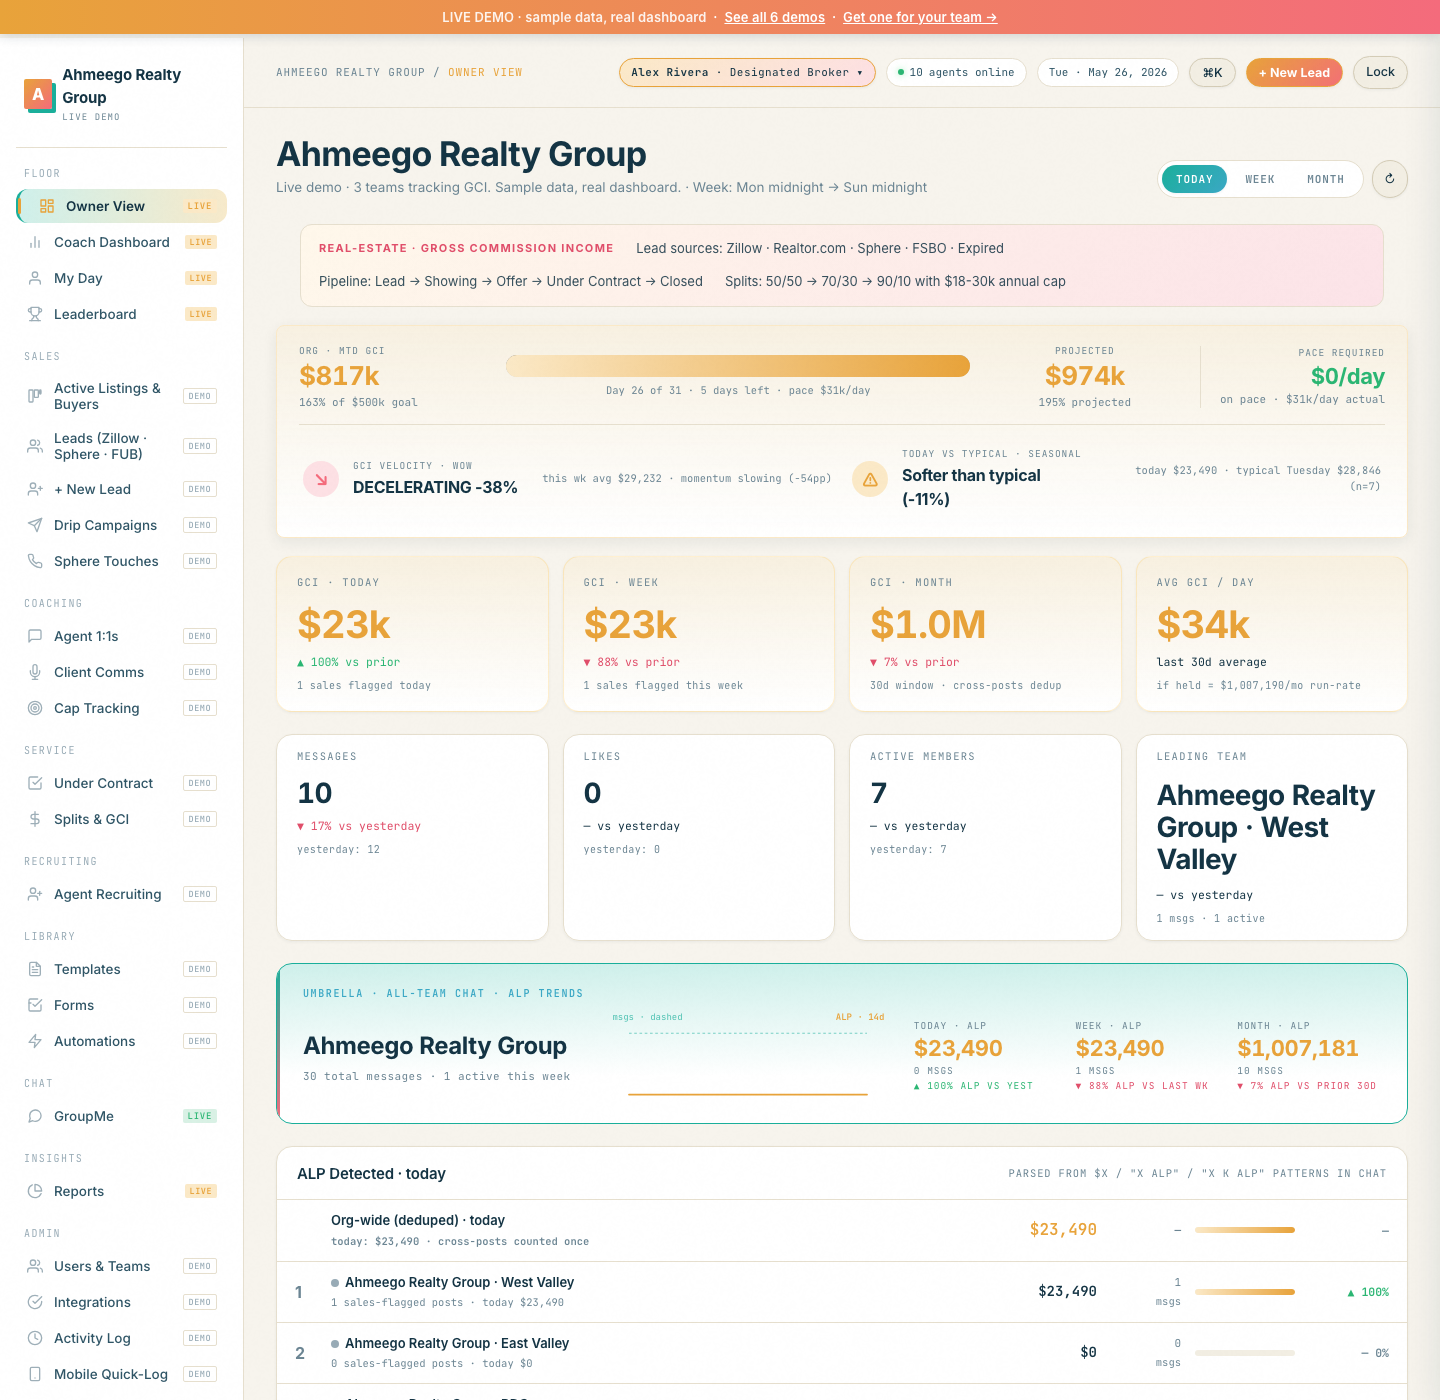
- GCI (Gross Commission Income) — north-star metric
- Net commission after split, cap, brokerage fee
- Average sales price per closed deal
- Units closed — separate from GCI
- Listings taken — leading indicator
- Listings sold — lagging indicator
- Days on market average
- Lead → Showing → Offer → Under Contract → Inspection → Appraisal → CTC → Closed
- Active listings vs Active buyers — separate pipelines
- Pre-approval status for buyers (huge filter)
- Earnest money deposit tracking
- Inspection contingency clock (7-10 days)
- Appraisal contingency + appraisal-gap coverage
- Zillow / Realtor.com paid leads
- OpenHouse Pro · CINC · Follow Up Boss · Sierra
- Sphere of influence — highest-converting source
- Referrals — 25% fee in/out tracking
- FSBO + Expired listings
- Door-knocking / geographic farming
- Commission splits 50/50 → 90/10 → 100% with caps
- Cap structure $18-30k typical annual cap
- Transaction coordinator fees $400-700 per deal
- E&O insurance monthly
- Skyslope / Dotloop brokerage tech stack
- MLS dues + NAR membership + local board
- Listing agents vs buyer agents vs dual
- ISA (Inside Sales Agent) — appointment setting
- Showing assistants — shadow income for newer agents
- Transaction coordinator — paperwork specialist
- Marketing coordinator — postcards, social, drip emails
- Team leader split with team members
- Open house Saturday/Sunday — primary lead-gen event
- Geographic farms — recurring door-knocking routes
- Annual home-anniversary touches to past clients
- Just-listed / just-sold mailers
- Drip campaigns with market updates
- Buyer consults vs listing presentations
- Days of inventory in primary market
- Median price trend YoY/MoM
- Months of supply (buyer's vs seller's market)
- Mortgage rate moves affect everything
- Commission week Mon midnight → Sun midnight
- Closings cluster on Fridays (~40% of closings)
- End-of-month closing rushes
- GCI by source — which lead source is profitable
- Lead → Appointment → Contract → Close conversion
- Average commission % (compressing 5-6% → 4-5%)
- Repeat / referral percentage of book
- Multiple-offer situations — letter strategy
- Mike Ferry / Tom Ferry / Buffini coaching cultural fingerprint
03 · LendingMortgage Loan Officers Open demo →
Products: Conv · FHA · VA · USDA · Jumbo · HELOC · Refi · Cash-out · Non-QM · DSCR · Bank-statement
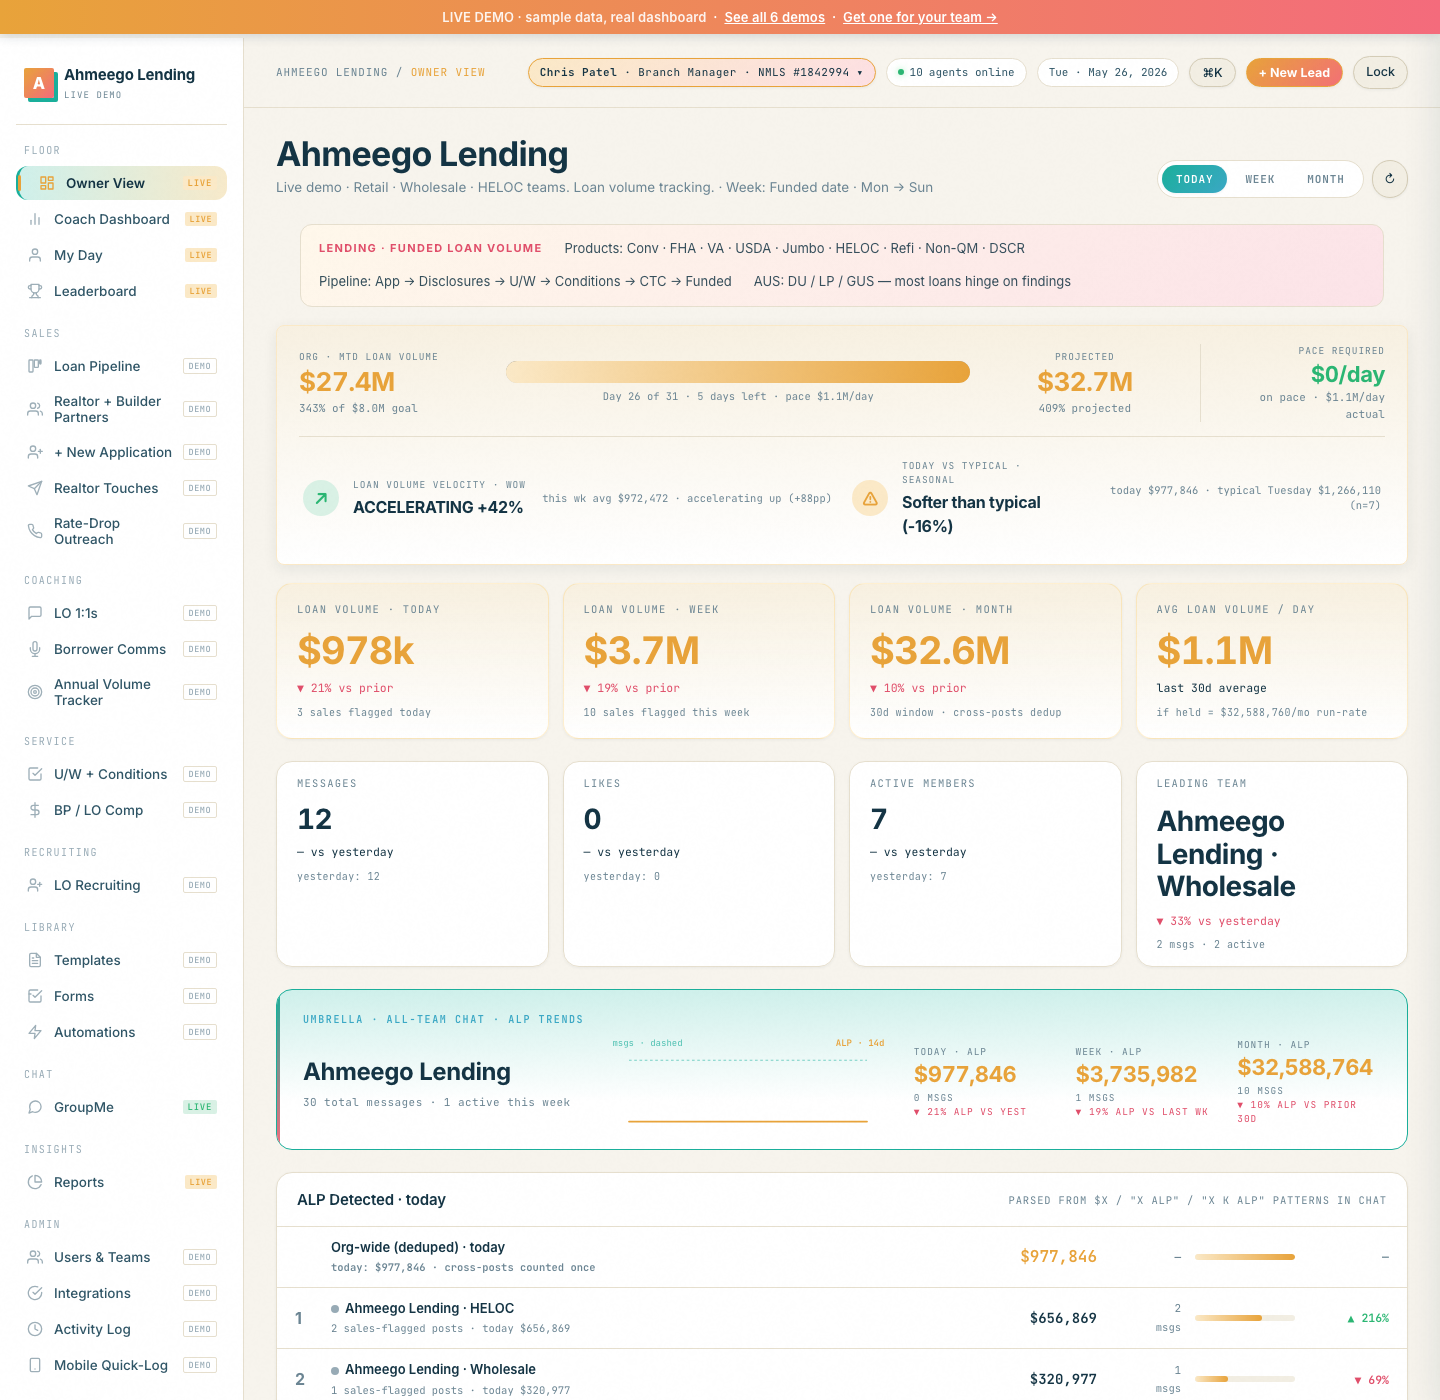
- Loan volume ($ funded) — north-star metric
- Units funded — separate from volume
- Pull-through rate (apps → funded) — most overlooked KPI
- Lock-to-funded conversion
- Average days in U/W
- Days from app to CD (closing disclosure)
- LO compensation % 0.75-1.75% of loan
- Conventional (Fannie/Freddie)
- FHA (low down, MI)
- VA (zero down, veterans)
- USDA (rural, zero down)
- Jumbo (above conforming)
- HELOC (home equity line)
- Refi vs Cash-out vs Streamline
- DSCR (investor, no income docs)
- Bank statement (self-employed)
- Non-QM alternative-doc
- Reverse mortgage separate license
- Lead → App → Disclosures → Conditions → AUS → CTC → Funded
- AUS findings: DU approve/eligible · LP accept · refer
- Conditions outstanding — biggest blocker
- Appraisal received + value support
- Title clear, encumbrances cleared
- CD sent → TRID 3-day clock
- Funded vs Closed — state-dependent
- Rate lock status — float vs locked
- Lock extensions cost per day
- Pricing concessions — LO gives up BPs
- Discount points — buy-down options
- Lender credits — closing-cost relief
- Realtor partners — top 5 drive 60-70%
- Builder relationships — captive volume
- Past clients — refi opportunities on rate drops
- Past clients — purchase referrals (move-ups)
- Direct-to-consumer leads ($150-400 CPL)
- CPA / FP referrals
- DTI average (debt-to-income)
- FICO average / range
- LTV distribution
- Cash-to-close average
- First-time buyer % of book
- Encompass (ICE Mortgage Tech) dominates LOS
- Calyx / Byte / LendingPad secondary
- AUS — DU / LP / GUS
- e-Sign / e-Close adoption
- Pipeline aging >30 / >45 / >60 days
- Lock expiration alerts 5/3/1-day-out
- Conditions chase — daily processor back-and-forth
- Commission week Mon → Sun standard
- Funded date is the comp event (not closed)
04 · AutoAuto Dealership Variable Ops Open demo →
F&I: VSC · GAP · Tire & Wheel · Paint Protection · Key Replacement · Prepaid Maintenance
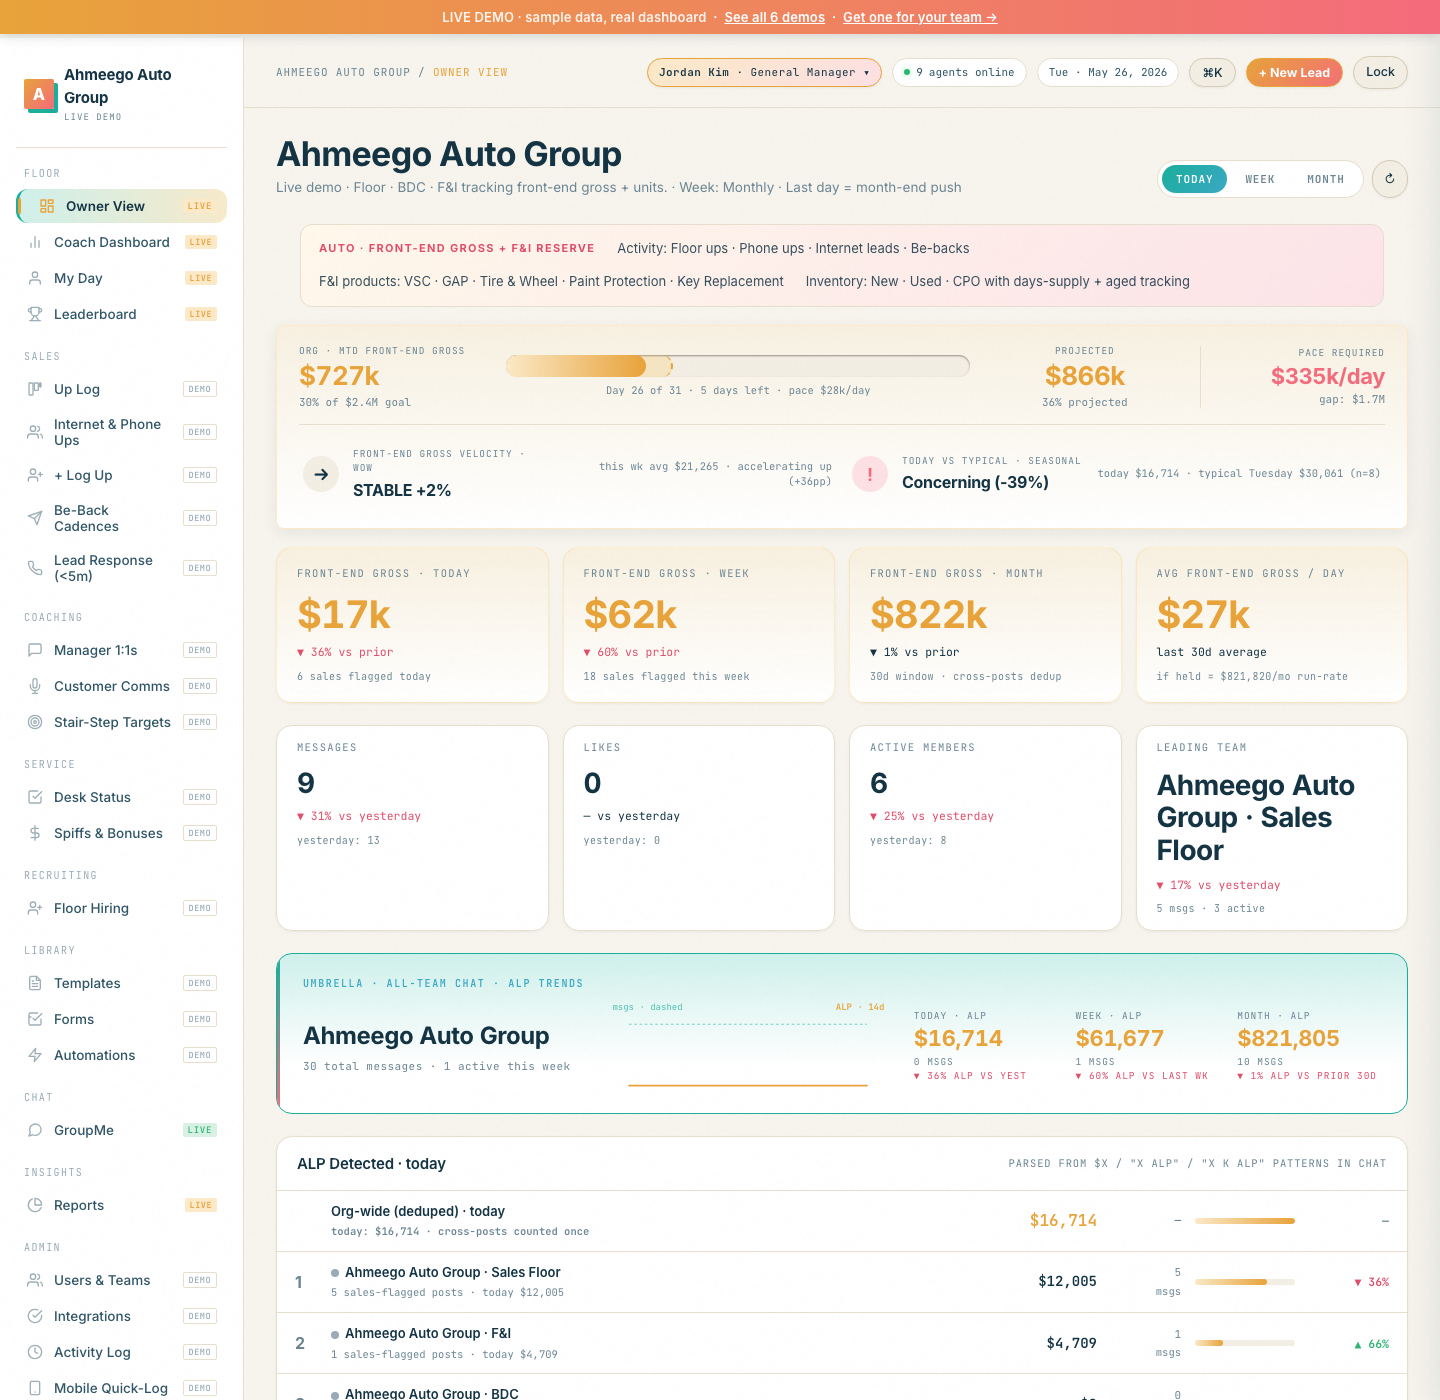
- Units sold (new + used) — primary metric
- Front-end gross per unit (PVR)
- Back-end gross (F&I per unit)
- Total gross per unit = front + back
- CSI score (Customer Satisfaction Index)
- Closing ratio — ups to deliveries
- Walk-rate — ups that left empty-handed
- Floor ups — walk-in visitors
- Phone ups — incoming calls
- Internet leads — AutoTrader, Cars.com, dealer site
- Be-backs — promised returners (track the log)
- Service-to-sales referrals
- Trade walks (T-walks) — appraisals
- Demo rides / test drives logged
- One-pencil close ratio
- New / Used / CPO mix
- Days supply — inventory burn rate
- Aged inventory >60 / >90 days
- Stock # vs VIN tracking
- Reconditioning cost per used unit
- Wholesale vs retail trade routing
- Extended warranty / VSC
- GAP insurance
- Prepaid maintenance
- Tire & wheel protection
- Key replacement
- Paint & fabric protection
- Theft protection / etching
- Disability / credit life (state-regulated)
- F&I PVR per-vehicle penetration $
- Spot delivery (delivered pre-funding)
- Yo-yo financing — re-contracting
- Sub-prime vs prime tier mix
- Cash / Finance / Lease
- Manufacturer captive (Ford Credit, GM Financial…)
- Bank lender ratios (Ally, Chase…)
- Finance reserve (markup)
- Lease residuals + money factor
- MSRP / invoice / holdback
- Doc fees (state-regulated)
- TTL (tax/title/license)
- OTD pricing (out-the-door)
- Manufacturer incentives (rebates, APR, lease cash)
- Loyalty / conquest cash
- DealerSocket / VinSolutions / Elead CRMs
- Reynolds / CDK DMS
- Stair-step incentives — sell X units, get $Y
- Spiff money — spot bonuses on specific units
- Monthly cycle — month-end is mythic
- CSI drag on commission — survey responses matter
05 · ABA TherapyABA Clinical Services Open demo →
Service codes: 97151 · 97152 · 97153 · 97154 · 97155 · 97156 · 97157 · 97158
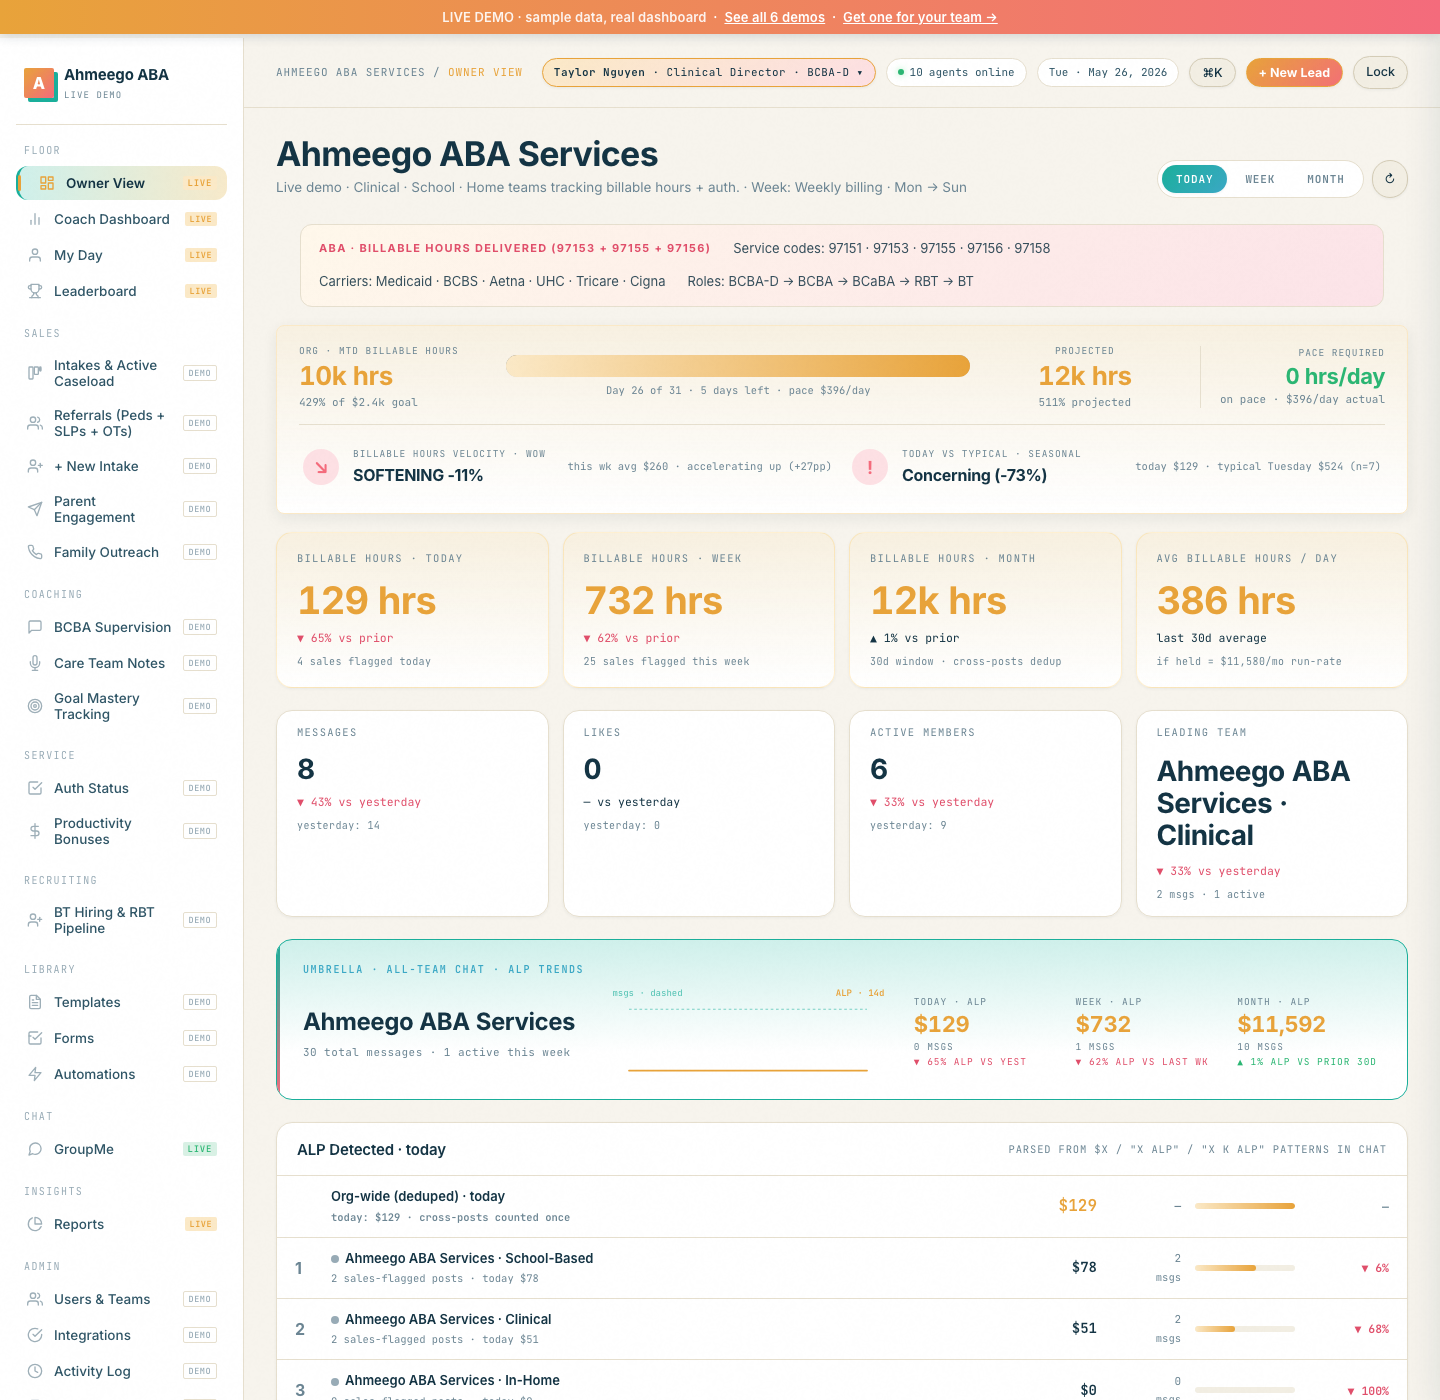
- Billable hours delivered — north-star metric
- Authorized hours vs delivered = utilization %
- Cancel rate — family cancels
- No-show rate — no cancel, no show
- Make-up sessions scheduled
- Caseload size per BCBA
- Average daily census
- 97151 — initial assessment
- 97152 — assessment update
- 97153 — adaptive behavior treatment by tech (the big one)
- 97154 — group adaptive behavior treatment
- 97155 — adaptive behavior treatment with protocol mod (BCBA)
- 97156 — family adaptive behavior treatment guidance
- 97157 — multi-family group parent training
- 97158 — group adaptive treatment with protocol mod
- BCBA — Board Certified Behavior Analyst
- BCBA-D — doctoral-level, often clinical director
- BCaBA — supervised under BCBA
- RBT — Registered Behavior Technician, 40-hr cert
- BT — pre-RBT or non-certified
- Clinical director / supervisor / case supervisor hierarchy
- Carrier mix — Medicaid · BCBS · Aetna · UHC · Tricare · Cigna · Optum
- Auth period typically 3 or 6 months
- Re-auth lead time 30-60 days before expiry
- Single Case Agreement (SCA) for out-of-network
- Funding-source change risks
- Self-pay separate track
- Medicaid waivers (state-specific)
- Center-based (highest utilization)
- In-home (drive time eats hours)
- School-based (IEP-driven)
- Telehealth parent training
- VB-MAPP Verbal Behavior Milestones
- ABLLS-R Basic Language and Learning Skills
- Vineland Adaptive Behavior Scales
- Mastery rate — targets met per cohort
- Behavior plan compliance by tech
- Restrictive procedures documentation
- Parent training compliance
- Tech turnover — #1 ABA crisis (30-60% normal)
- 30-60-90 day retention for new BTs
- RBT cert pipeline — 40-hr + competency + supervisor sign-off
- Supervision hours — mandated 5-10% of BT hours
- Caseload assignment — 8-15 typical per BCBA
- Drive time / mileage for in-home techs
- PTO / sick coverage — lost hours are unrecoverable
- Discharge planning — fade schedule + goals met
- Discharge vs admission = net census change
- Waitlist length (regional bottleneck)
- Burnout — dominant clinical-ops issue
06 · Ad SalesAdvertising Sales Teams Open demo →
Pricing: CPM · CPC · CPV · CPCV · Flat-rate sponsorships · Programmatic guaranteed
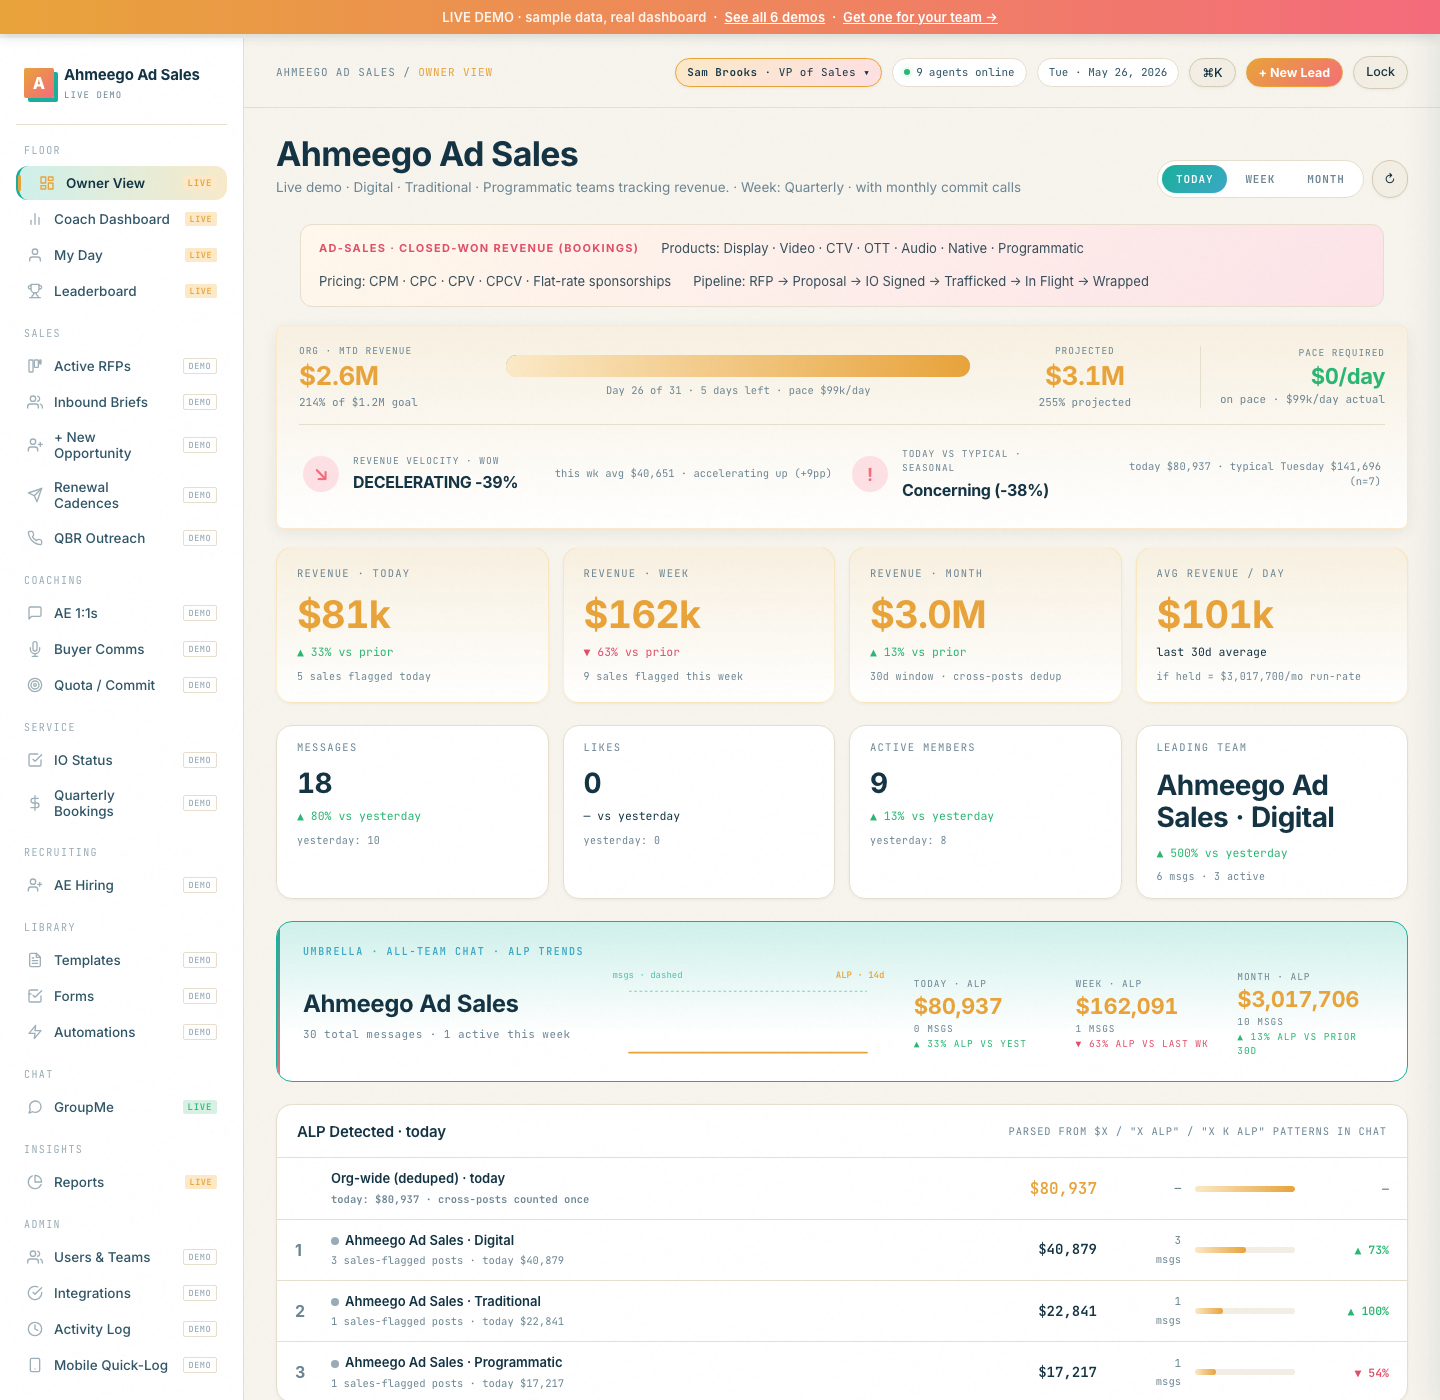
- Revenue closed (Q-to-date, YTD)
- Bookings vs revenue rec — different timing
- Pipeline value — weighted vs un-weighted
- Win rate — closed-won / (won + lost)
- Sales cycle length by deal size
- Average deal size per account
- Renewal rate of existing accounts
- NRR (Net Revenue Retention) incl expansion
- Churn rate
- Commit / Best Case / Pipeline / Omitted forecast hygiene
- Stage age — deals stuck >30 days
- Slippage — deals pushed to next quarter
- Pipeline coverage — pipeline / quota ≈ 3-4x
- Display (banner / standard)
- Video / pre-roll / mid-roll
- CTV (Connected TV)
- OTT (Over The Top)
- Audio (streaming + podcast)
- Native content
- Sponsorship packages (tentpole)
- Programmatic guaranteed vs PMP vs open exchange
- Co-op funds (manufacturer match)
- Multi-property packages bundled inventory
- CPM (Cost Per Mille)
- CPC (Cost Per Click)
- CPV (Cost Per View)
- CPCV (Cost Per Completed View)
- Flat-rate sponsorships
- Floor pricing by inventory tier
- Premium vs remnant inventory
- RFP incoming opportunity
- Brief sent to AdOps
- Proposal sent (IO draft)
- IO signed
- Creative trafficked to ad server
- Live in flight
- Pacing — ahead/behind delivery
- Make-goods for under-delivery
- Discrepancy management (publisher vs DSP)
- Wrap-up report sent to client
- Direct advertiser vs agency vs trading desk
- Account tier Tier 1 / 2 / 3
- Vertical specialization (auto, retail, healthcare…)
- Account penetration — share of wallet
- Multi-year contracts with upfront commitments
- DSP/SSP integrations (DV360, TTD…)
- Brand safety scores by buyer
- Viewability (MRC 70%+)
- Attribution studies (Nielsen, Lucid…)
- Upfront / NewFronts seasonality
The pattern
Read down any of those columns and you'll notice the same thing: none of these are "deals" in a generic CRM sense. They're status codes, regulatory artifacts, mandated supervision ratios, channel-specific units of inventory, comp-week boundaries, lead-source attribution buckets. The industry's actual operating texture.
A general-purpose CRM has two options: ignore them (and let salespeople run the real numbers in a spreadsheet), or stuff them into custom fields that nobody fills in correctly. Either way, the dashboard ends up lying. The tracker doesn't have that problem because it was rebuilt for the industry, not retrofitted onto it.
That's what each of the six live demos above proves. Same engine. Six different working vocabularies. Click any of them and look at the sidebar, the KPI labels, the message stream — every word is from inside that industry.
Your industry isn't on this list?
Tell us what your team actually tracks — your KPIs, your stages, your role names. If the shape fits, we'll build a custom demo within 48 hours.
Request your tracker → See all 6 demos