The Same Sales Tracker for Real Estate, Loans, Auto, ABA Therapy, and Ad Sales
When you abstract a sales team to its bones, every industry has the same shape: reps, teams, a metric per day, a goal per month, and a coach who needs to know what to say tomorrow. That's why six wildly different industries can use the same dashboard. Here's how each one maps.
The math is the same. The vocabulary is not. The demos prove the second part.
A generic CRM forces every industry into the same words: "deals," "stages," "contacts." But a real estate agent doesn't track "deals" — they track listings, showings, contracts, and closings. A BCBA doesn't have "leads" — they have referrals, intakes, and re-auths. The dashboard knows that. Each of the six demos below uses the actual language of its industry — pipeline stages, product codes, role names, KPI labels, even the commission-week boundaries.
If you want the deeper cut, see 50 things each industry tracks that generic CRMs miss — 300 nuances across six verticals.
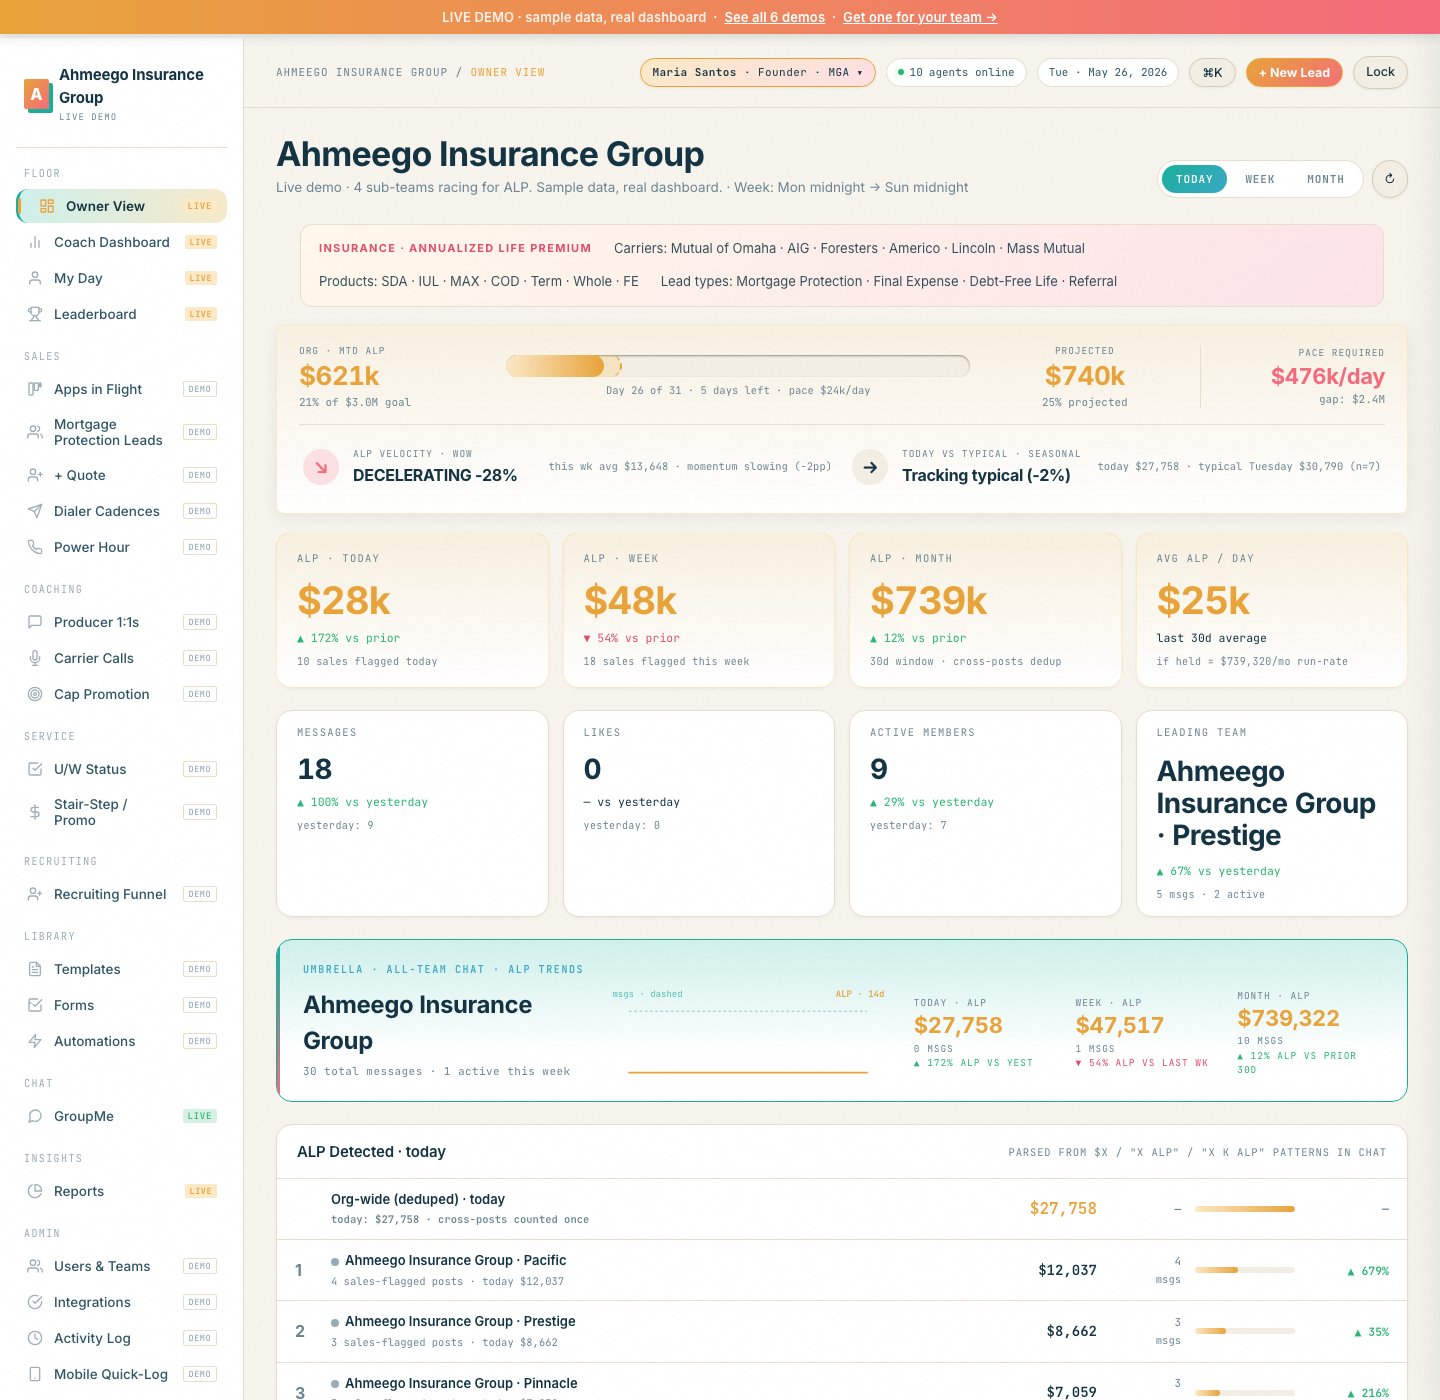
Life Insurance Agencies
The tracker was born here. Two agencies — Bane Organization and Summit Agency — needed
a live floor board that read GroupMe messages and extracted ALP from text like
"$1,840 SDA +2". The dashboard tracks rep-level production, parent-and-children team
hierarchy, and AI-coached daily insights.
What the demo actually surfaces (vs a generic CRM):
- Submitted ALP vs Issued ALP vs Paid ALP — three different numbers
- 13-month persistency + first-30-day chargeback watch
- Stair-step cap promotion (CC → EC → MGA → SA)
- Production-to-recruit ratio (IMO health metric)
- Power Hour dial blocks, not generic "calls"
- Carrier-specific U/W status (Mutual, AIG, Foresters…)
- Mortgage Protection lead source attribution
- 90-day new-writer washout rate
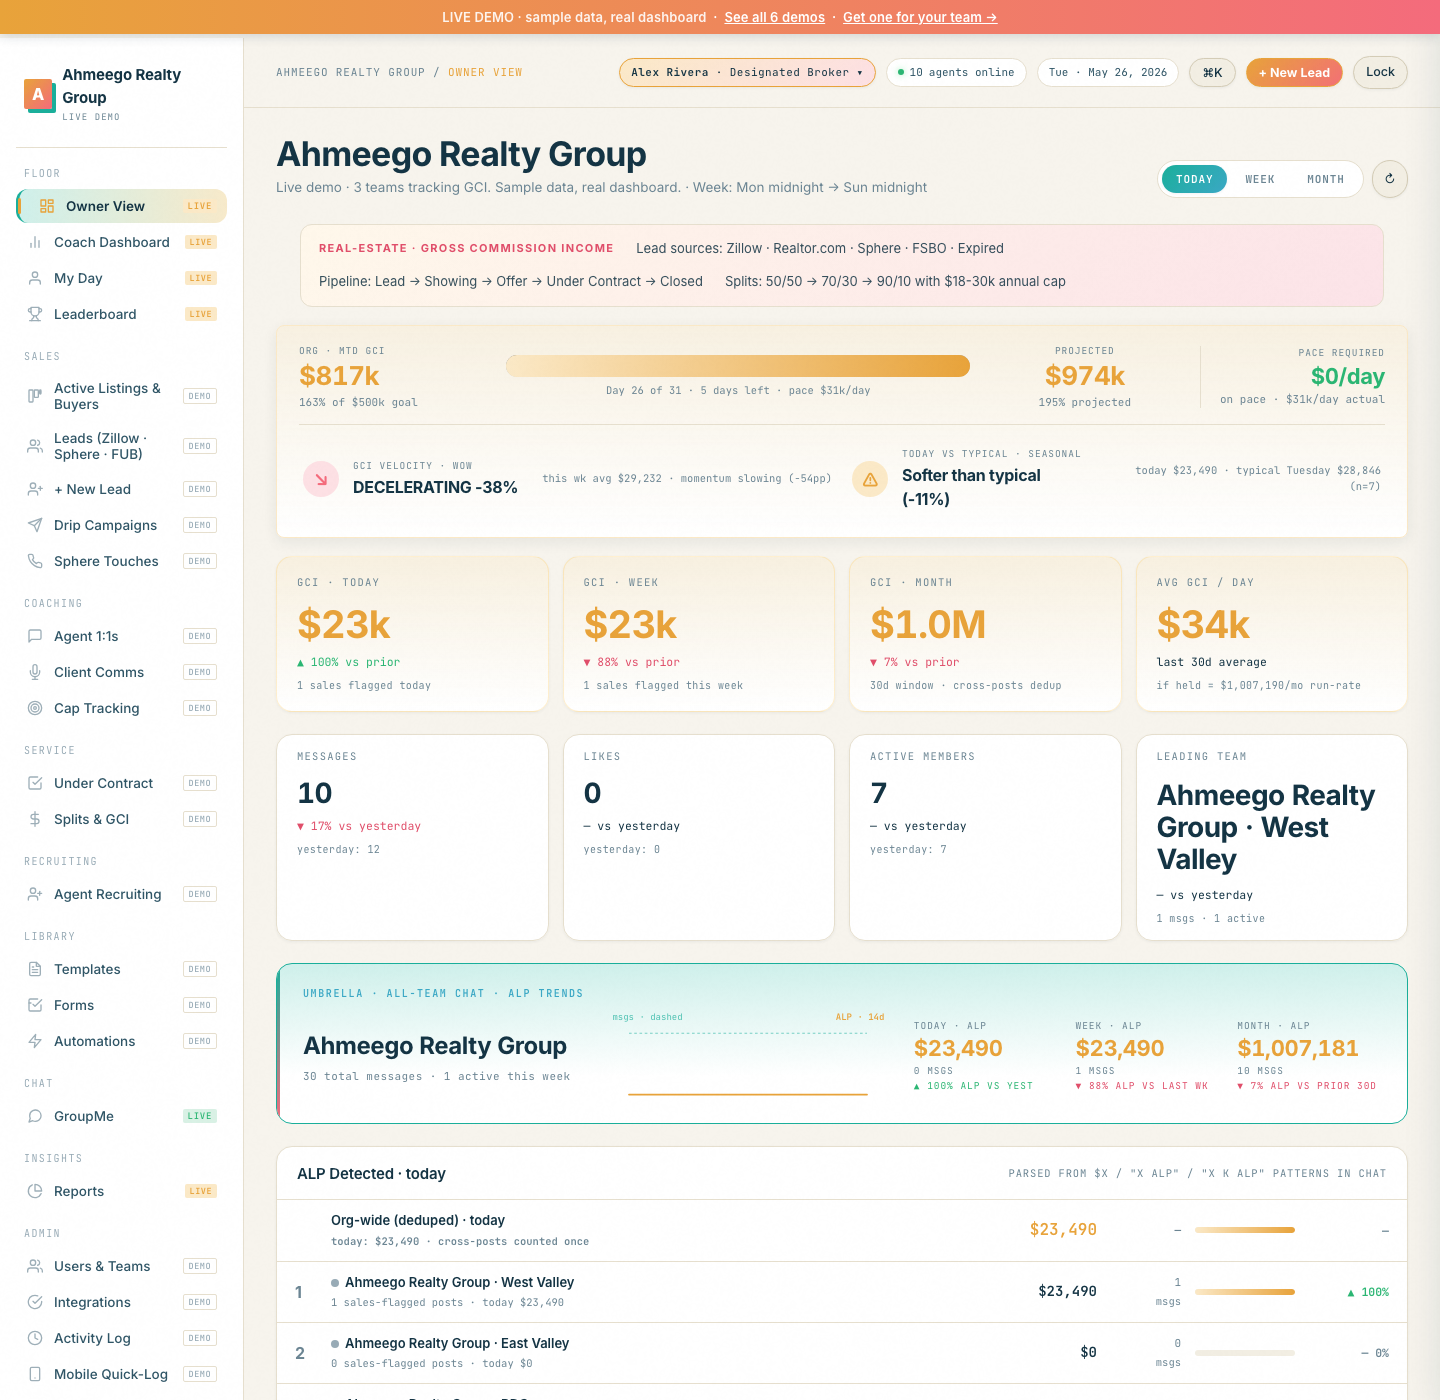
Real Estate Brokerages
Most brokerages already pay for GoHighLevel or Follow Up Boss for lead capture and SMS drips. Those tools are good at marketing — they're terrible at showing a broker who's hot, who's cold, and who needs a check-in this week. The tracker is the performance layer on top.
What the demo actually surfaces (vs a generic CRM):
- GCI + net commission (after split + cap + brokerage fee)
- Active Listings vs Active Buyers as separate pipelines
- Days on Market trend, Avg Sale Price, Listings Taken
- Lead source by Zillow / Realtor / Sphere / FSBO / Expired
- Split tier visibility (50/50 → 70/30 → 90/10 → cap)
- Open house Set → Show conversion, Saturday cohort
- Sphere touch cadence + past-client anniversary tracking
- Under-contract clock (EM, inspection, appraisal, CTC)
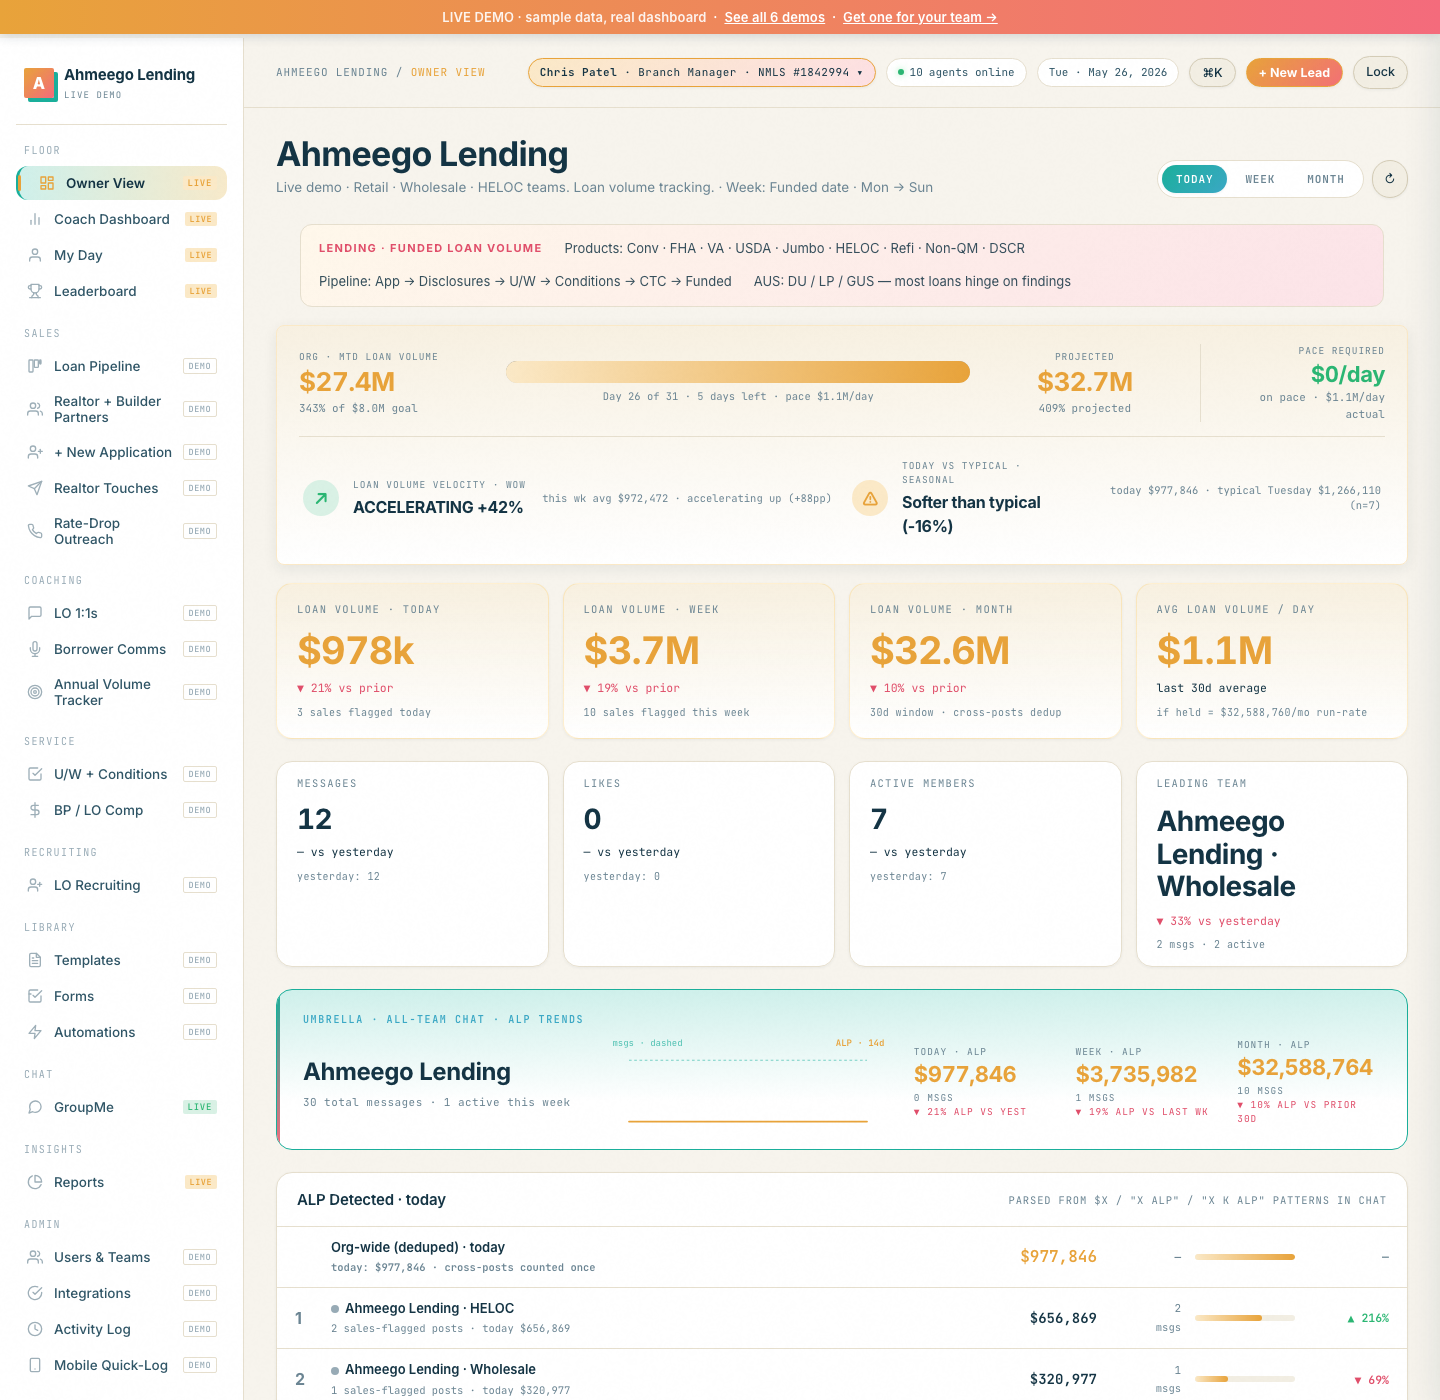
Loan Officers + Mortgage Teams
Loan officers live in spreadsheets, Encompass, and Slack. Velocify is the dominant lead-management tool, but it's an LOS gatekeeper — not a coaching dashboard. The tracker sits next to your LOS and shows the floor in real time.
What the demo actually surfaces (vs a generic CRM):
- Pull-through rate (apps → funded), not just app count
- Days in U/W, AUS status (DU approve / LP accept / refer)
- Conditions outstanding per file, with stale-app aging
- Lock expiration alerts (5/3/1 day-out warnings)
- Realtor + builder partner attribution by referral source
- Loan type mix (Conv · FHA · VA · Jumbo · HELOC · Refi · Non-QM)
- Average DTI / FICO / LTV / cash-to-close for the book
- Past-client refi outreach lists when rates drop
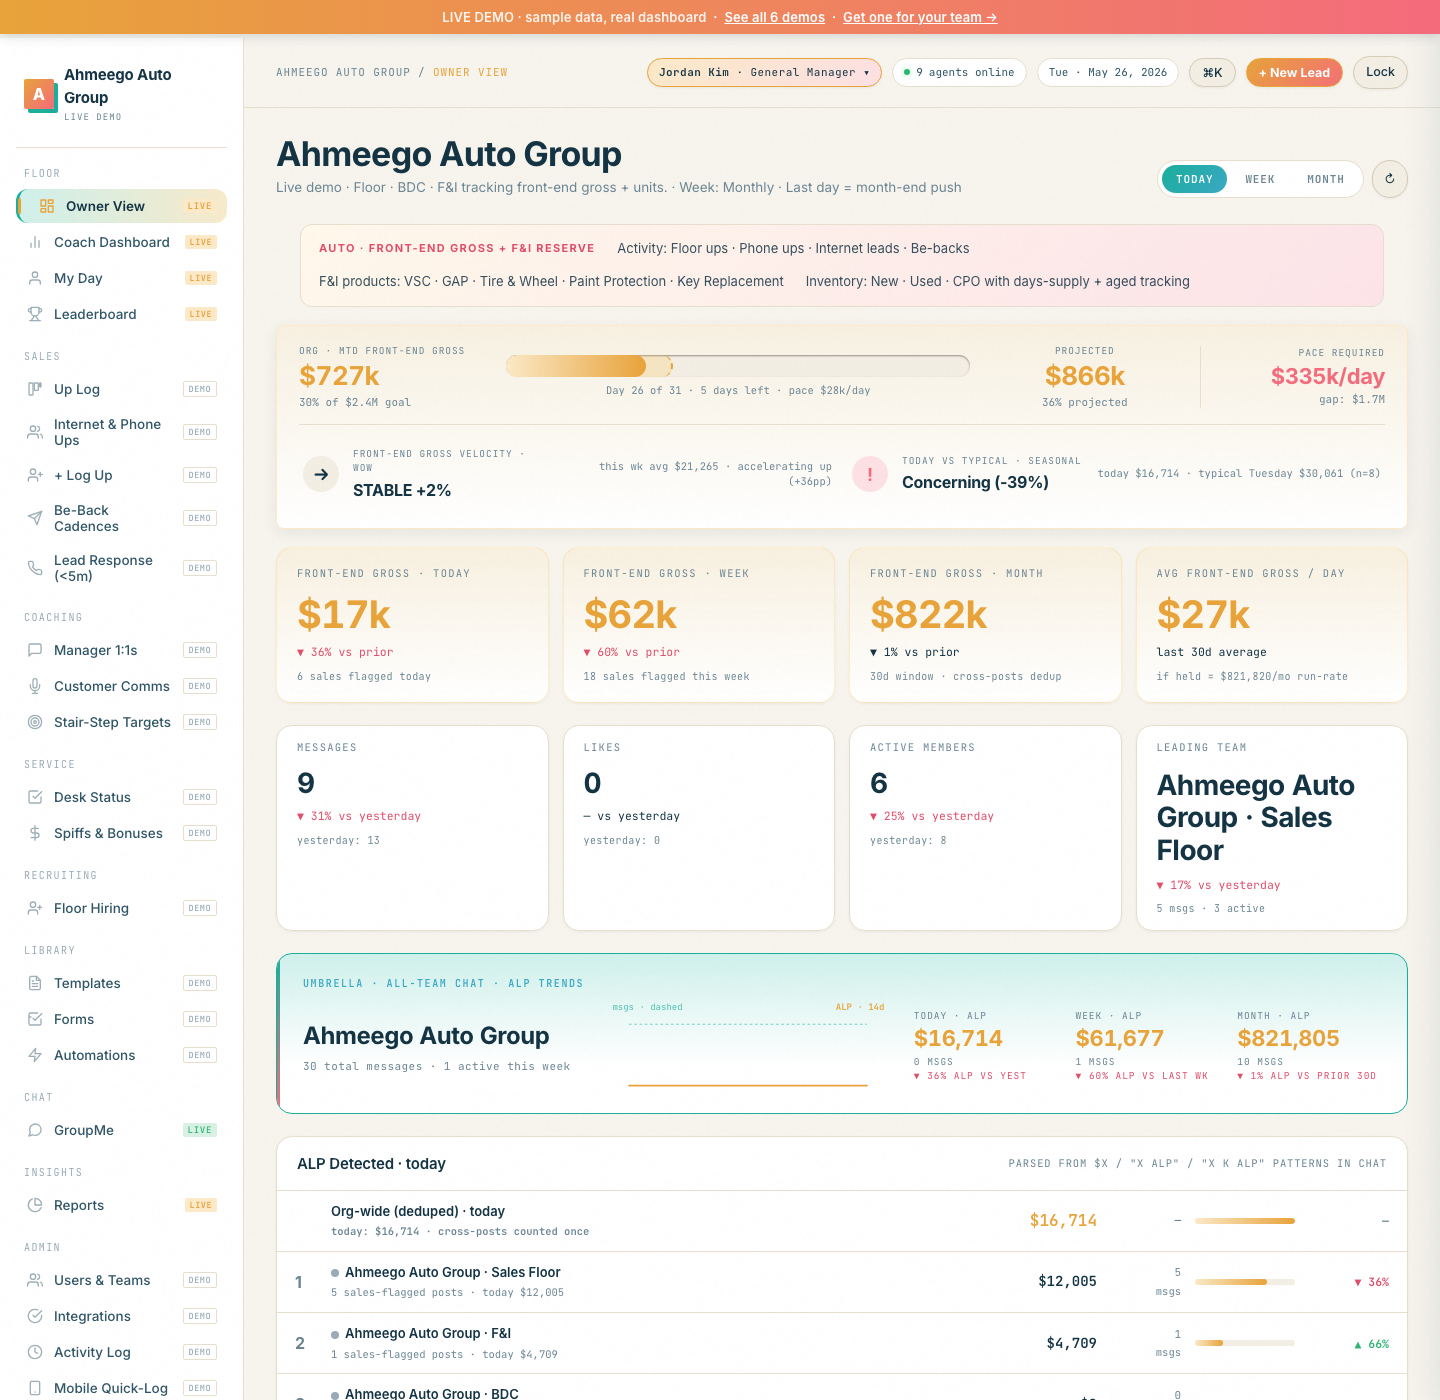
Auto Dealerships
DealerSocket and VinSolutions own the auto retail space — and they cost $400+/seat with multi-month implementations. The tracker delivers the LED-scoreboard energy of the floor without the price tag or vendor lock-in. Add the live floor feed in the BDC room and you've got real-time motivation.
What the demo actually surfaces (vs a generic CRM):
- Front-end gross + F&I per-vehicle (PVR) — both numbers matter
- Up log: Floor ups · Phone ups · Internet leads · Be-backs
- Closing ratio (ups → deliveries), walk-rate
- F&I product penetration: VSC, GAP, Tire/Wheel, Paint, Key
- CSI score watch (manufacturer report card)
- Inventory age: New / Used / CPO with days-supply + aged units
- Lead response under 5 minutes (BDC SLA)
- Month-end pace + manufacturer stair-step tracking
ABA Therapy Clinics
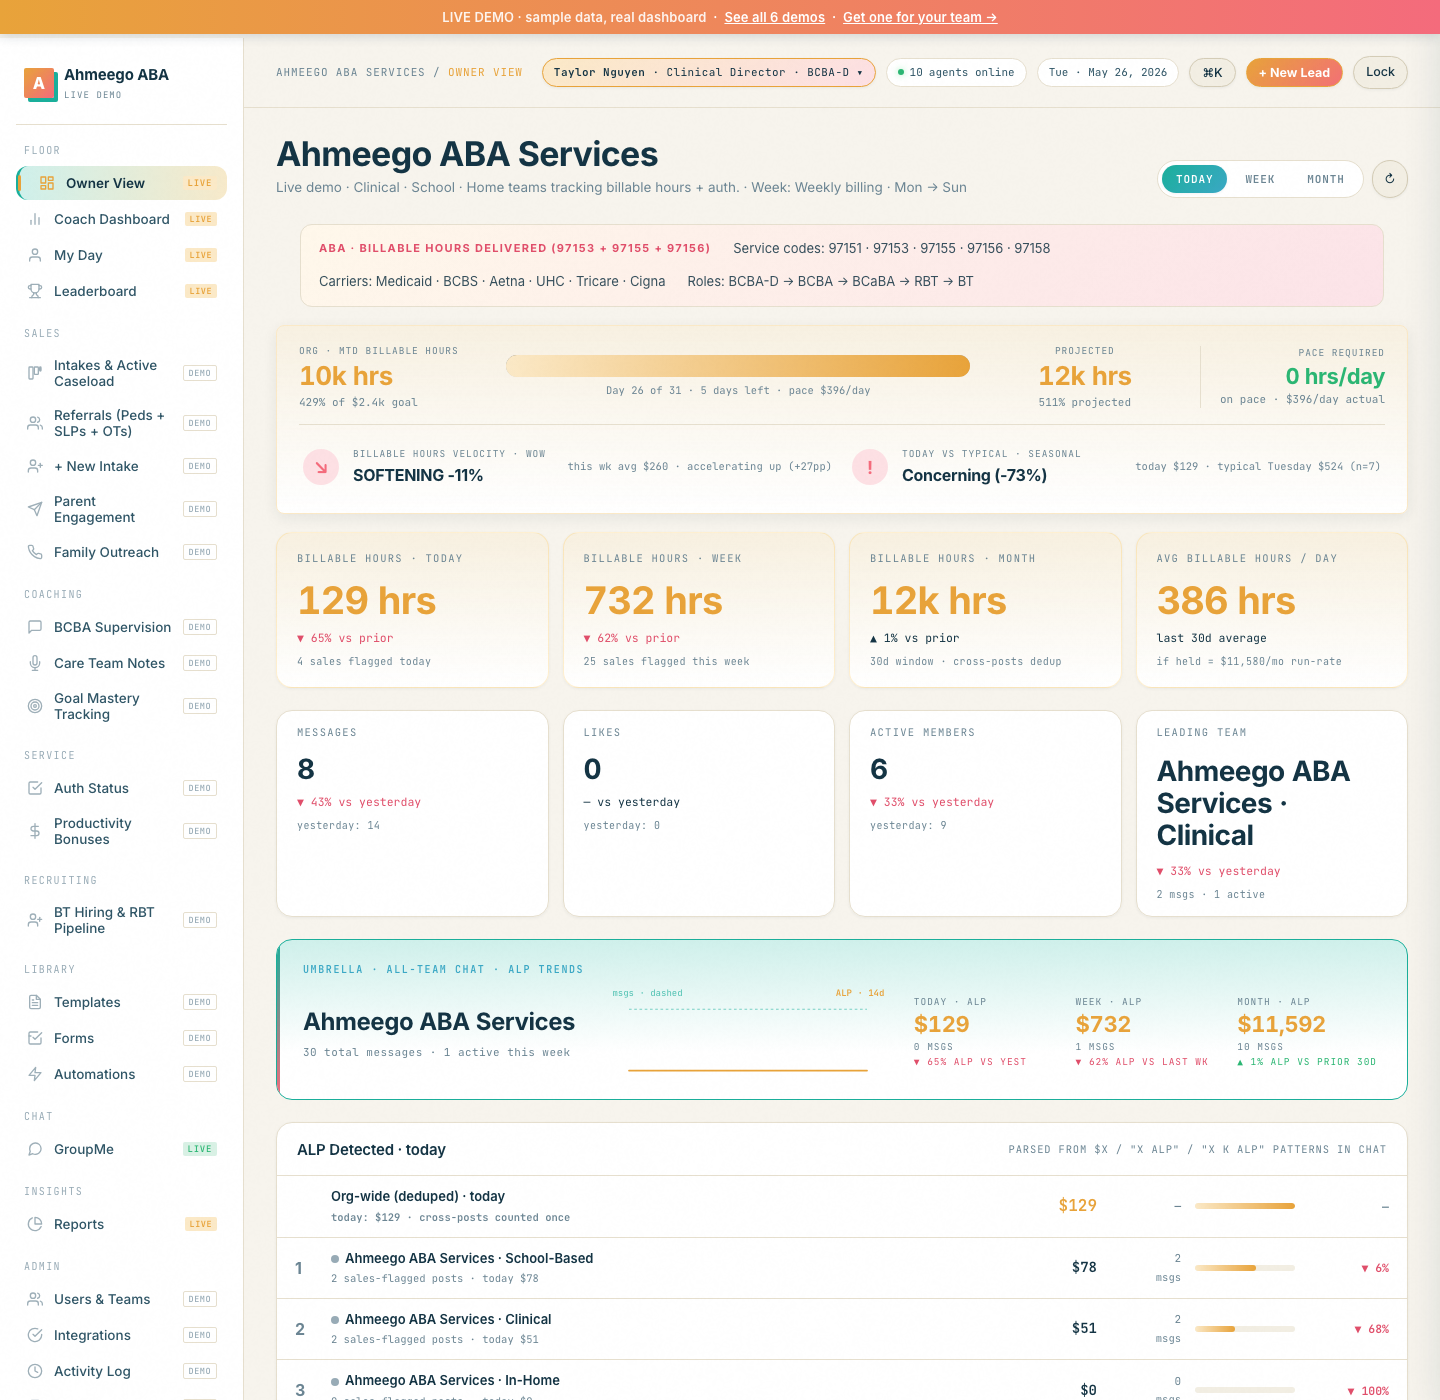
This one isn't sales, technically — but the shape is identical. BCBAs (supervisors) manage caseloads of BTs (technicians). Each BT has authorization hours to fulfill. Burnout is the #1 reason ABA clinics lose techs. The tracker reads billable-hour patterns and flags before someone quits.
What the demo actually surfaces (vs a generic CRM):
- Billable hours (97153, 97155, 97156) — not "deal value"
- Authorization utilization % per client + per BCBA caseload
- Cancellation rate, no-show rate, make-up scheduling
- BCBA supervision hours (mandated 5-10% of BT hours)
- RBT cert pipeline: 40-hour training progress per BT
- 30-60-90 day BT retention (turnover is the #1 ABA crisis)
- Re-auth submission lead time + carrier mix (BCBS, Aetna, Medicaid…)
- Goal mastery rate per cohort, discharge planning
Advertising Sales Teams
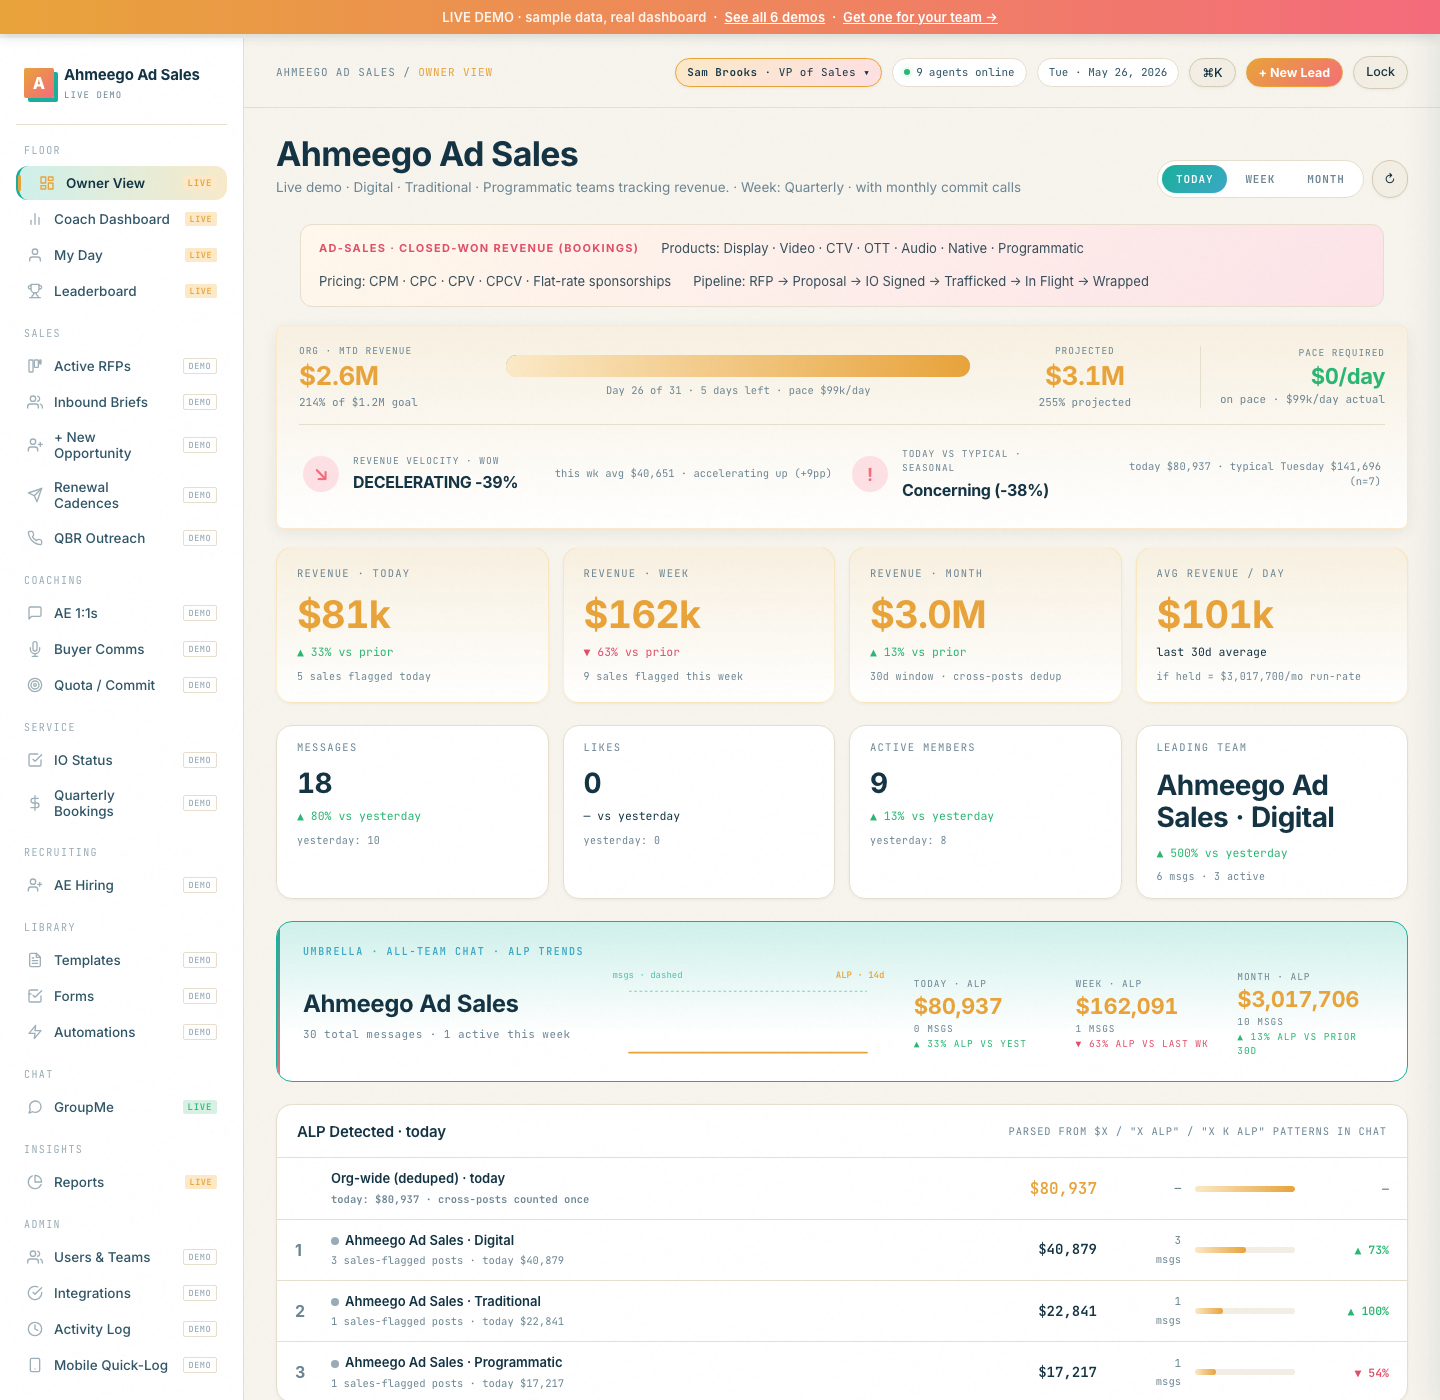
Ad agencies and broadcast/digital media reps live in spreadsheets and Salesforce. The tracker replaces the "where are we at the end of the month" question with a running answer — and adds AI coaching that knows the difference between a stalled proposal and a fresh prospect.
What the demo actually surfaces (vs a generic CRM):
- Commit · best-case · pipeline · omitted forecast hygiene
- Win rate, sales cycle length, avg deal size by tier
- Renewal rate + NRR (net revenue retention)
- Active RFPs in flight + IO trafficking status
- Pacing alerts (ahead / behind delivery) with make-good count
- Pipeline coverage ratio (typically 3-4x quota target)
- Channel mix: Display · Video · CTV · OTT · Audio · Native · Programmatic
- Quarter-end push + upfront / NewFronts seasonality
What's not in the list (yet)
The same dashboard works just as well for: SaaS sales teams (ARR, signed contracts, MRR change), roofing and home services (jobs sold, average ticket, appointment-set rate), recruiting agencies (placements, retention, time-to-fill), and fundraising development teams (gifts closed, donor outreach, retention rate). If you have reps, teams, a number, and a goal — it works.
Don't see your industry? It probably still fits.
Tell us your metric label and team structure. If the shape is right, we'll have a custom demo built within 48 hours.
Request your tracker → See all 6 demos